Debugging Webhooks in Production: A Systematic Approach
Learn how to debug webhook issues in production with a systematic approach covering signature failures, timeouts, parsing errors, and more. Includes practical tools, real examples, and step-by-step checklists.

Debugging Webhooks in Production: A Systematic Approach
Webhooks fail silently. Issues manifest as missing data, delayed notifications, confused customers. Debugging invisible failures requires systematic approach and right tools.
This guide provides a practical framework for diagnosing and resolving webhook issues in production—whether sending to customers or receiving from third parties.
Common Issues
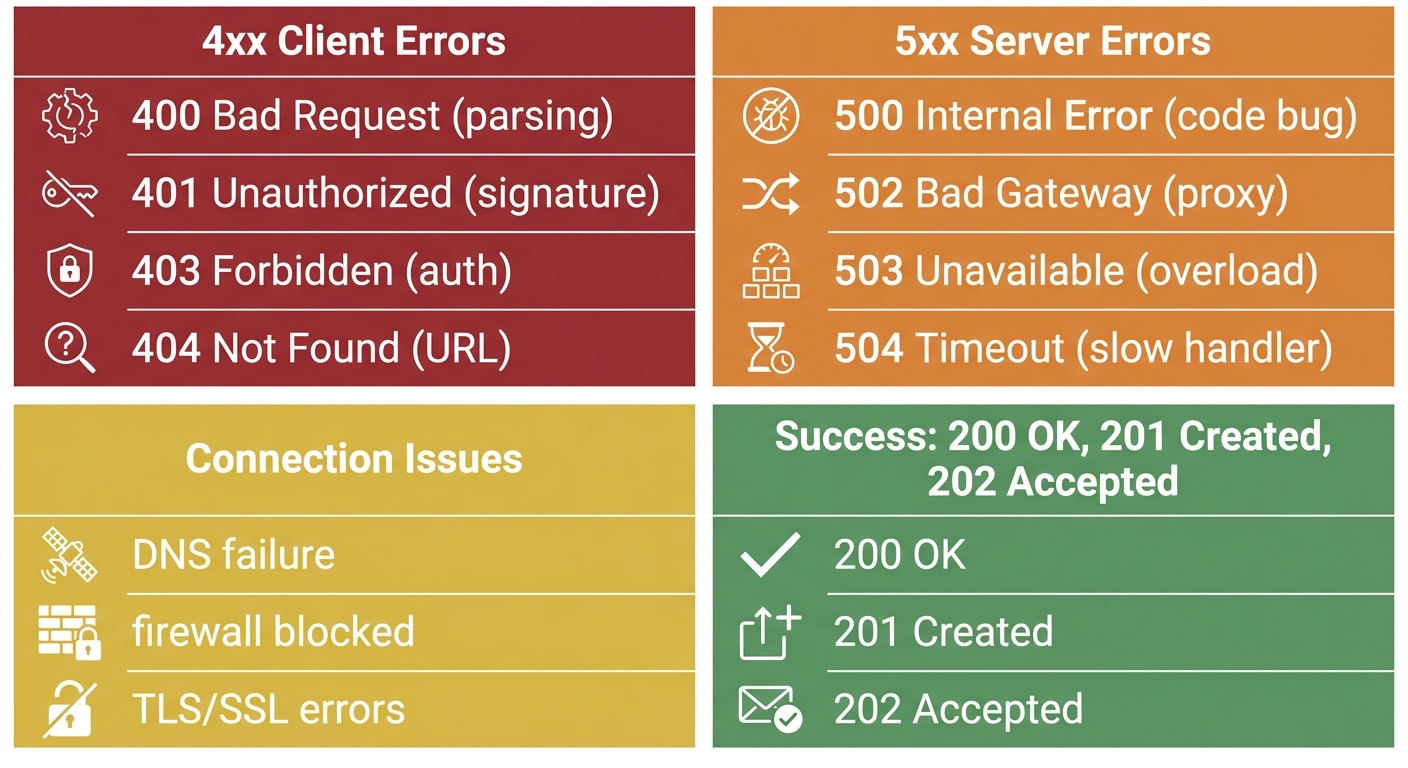
Understanding error categories accelerates diagnosis. HTTP status codes reveal the failure type immediately.
Signature Failures
Most common source of integration failures. Typically 401 or 403 responses.
Causes:
- Incorrect webhook secret
- Payload transformation by middleware
- Encoding mismatches
- Clock skew in timestamp signatures
- Secret rotation without updating receiver
Timeouts
Most providers expect response within 5-30 seconds.
Causes:
- Synchronous processing of complex logic
- Database queries blocking response
- External API calls in handler
- Cold starts in serverless
- Resource exhaustion
Parsing Errors
JSON parsing failures.
Causes:
- Content-Type mismatches
- Special character encoding
- Schema changes
- Middleware consuming raw body
- Buffer/string conversion issues
Missing Events
Hardest to debug—no error to investigate.
Causes:
- Events not enabled in provider dashboard
- Endpoint URL typos or outdated URLs
- Network connectivity (firewalls, DNS)
- Provider-side filtering/rate limiting
- Events queued but not delivered yet
Duplicates
Receiving same webhook multiple times.
Causes:
- Provider retries after timeout (though processing succeeded)
- Missing idempotency
- Multiple endpoints registered
- Network duplicate transmissions
Rate Limiting (429)
Provider throttling your endpoint due to high volume.
Causes:
- Burst traffic exceeding endpoint capacity
- Shared infrastructure limits (GitLab: per-minute webhook limits)
- DDoS protection triggering false positives
- Multiple services hitting same endpoint
Solutions:
- Implement queue-based processing to absorb bursts
- Scale endpoint infrastructure
- Configure provider-specific rate limits
- Use dedicated webhook endpoints per provider
SSL/TLS Certificate Errors
HTTPS validation failures prevent delivery entirely.
Causes:
- Expired certificates
- Self-signed certificates in production
- Missing intermediate certificates in chain
- Certificate/domain name mismatch
Diagnosis:
# Check certificate chain
openssl s_client -connect yourapi.com:443 -servername yourapi.com

# Verify certificate expiration
echo | openssl s_client -connect yourapi.com:443 2>/dev/null | openssl x509 -noout -dates
Use SSL Checker to identify intermediate certificate gaps.
Silent Failures
HTTP 200 returned but processing failed internally. No retry triggered, no error logged.
Causes:
- Try/catch swallowing exceptions
- Fire-and-forget async operations
- Missing error propagation in middleware
- Database writes failing silently
Prevention:
app.post('/webhooks', async (req, res) => {
  try {
    await processWebhook(req.body);
    res.status(200).send('OK');
  } catch (error) {
    // Log the failure
    console.error('Webhook processing failed:', error);
    // Return error so provider retries
    res.status(500).send('Processing failed');
  }
});
Memory Leaks
Long-running webhook handlers accumulating resources.
Causes:
- Unclosed database connections
- Event listeners not removed
- Large payloads held in memory
- Circular references preventing garbage collection
Detection:
// Monitor memory usage in handler
const used = process.memoryUsage();
console.log(`Memory: ${Math.round(used.heapUsed / 1024 / 1024)}MB`);
Debugging Workflow
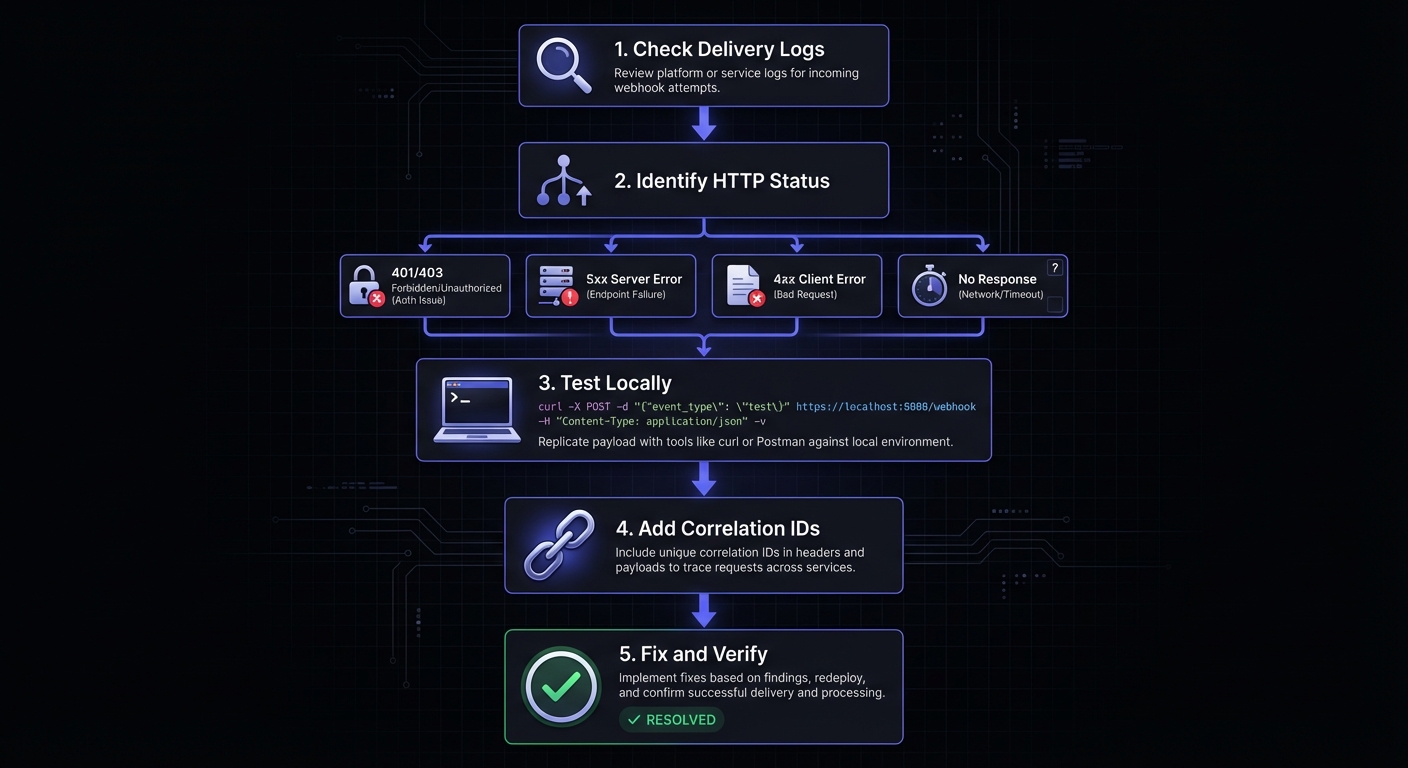
Step 1: Delivery Logs
Start with the source of truth: provider's delivery logs. Show exactly what sent, when, and response received.
Look for:
- HTTP status codes from endpoint
- Response times per attempt
- Request headers and payload
- Error messages in response
- Retry attempts and outcomes
Filter by endpoint, time range, status, event type to narrow down issues.
Step 2: Verify Signatures
If 401 or 403 responses, signature verification is likely culprit. Verify implementation step-by-step:
// Debug signature verification by logging intermediate values
function debugSignatureVerification(payload, receivedSignature, secret) {
  console.log('Raw payload length:', payload.length);
  console.log('Raw payload (first 200 chars):', payload.substring(0, 200));
  console.log('Received signature:', receivedSignature);

  const expectedSignature = crypto
    .createHmac('sha256', secret)
    .update(payload, 'utf8')
    .digest('hex');

  console.log('Expected signature:', expectedSignature);
  console.log('Signatures match:', receivedSignature === expectedSignature);

  return receivedSignature === expectedSignature;
}
Critical: Verify against raw body, not parsed/re-serialized. JSON re-stringify changes whitespace and key ordering.
// WRONG
app.post('/webhooks', express.json(), (req, res) => {
  const payload = JSON.stringify(req.body); // Will fail!
  verifySignature(payload, signature, secret);
});

// CORRECT
app.post('/webhooks', express.raw({ type: 'application/json' }), (req, res) => {
  const payload = req.body.toString(); // Original preserved
  verifySignature(payload, signature, secret);
});
Step 3: Test Locally
Isolate problems by testing captured payloads locally:
curl -X POST http://localhost:3000/webhooks \
  -H "Content-Type: application/json" \
  -H "X-Webhook-Signature: abc123..." \
  -d '{"event":"payment.completed","data":{"id":"pay_123"}}'
Isolates network issues, lets you debug with breakpoints. Add verbose logging to trace through handler.
Step 4: Trace End-to-End
Production-only issues: add correlation IDs and structured logging. Log trace ID, stage, timestamp, event type at each step. Creates audit trail showing exactly where processing fails.
Debugging Tools
Testing Services
Webhook.site captures incoming requests. Perfect for verifying webhooks sent correctly. RequestBin offers similar functionality plus team collaboration.
Request Inspection
ngrok exposes local dev server to the internet:
npm run dev
ngrok http 3000
# Use generated URL as webhook endpoint
Web interface at http://localhost:4040 shows all requests with replay functionality.
CLI Testing
Use curl to test endpoints with various scenarios. Generate signatures with openssl, send test payloads with correct headers.
Replay
Replay failed webhooks for debugging and recovery. Individual or bulk replay by time range.
Provider-Specific Tools
| Provider | Dashboard Location | Key Features |
|---|---|---|
| Stripe | Developers > Webhooks > Select endpoint | Delivery history, retry, resend |
| GitHub | Settings > Webhooks > Recent Deliveries | Request/response, redeliver |
| Shopify | Settings > Notifications > Webhooks | Failed webhooks log, manual retry |
| Twilio | Console > Monitor > Logs | Request inspector, debugging |
Stripe CLI enables local webhook testing:
stripe listen --forward-to localhost:3000/webhooks
stripe trigger payment_intent.succeeded
GitHub CLI checks webhook status:
gh api repos/{owner}/{repo}/hooks/{hook_id}/deliveriesReal Examples
Example 1: Intermittent Signature Failures
Symptom: 10% fail randomly.
Issue: Failures when payload had Unicode. Handler used payload.length (string length) instead of Buffer.byteLength(payload) for content-length validation.
Solution:
// Before (wrong)
if (payload.length !== parseInt(req.headers['content-length'])) { }

// After (correct)
if (Buffer.byteLength(payload, 'utf8') !== parseInt(req.headers['content-length'])) { }
Example 2: Timeouts
Symptom: Consistent 30-second timeouts.
Issue: Database query for deduplication taking 25+ seconds. Missing index on webhook_event_id.
Solution:
CREATE INDEX idx_webhooks_event_id ON processed_webhooks(event_id);
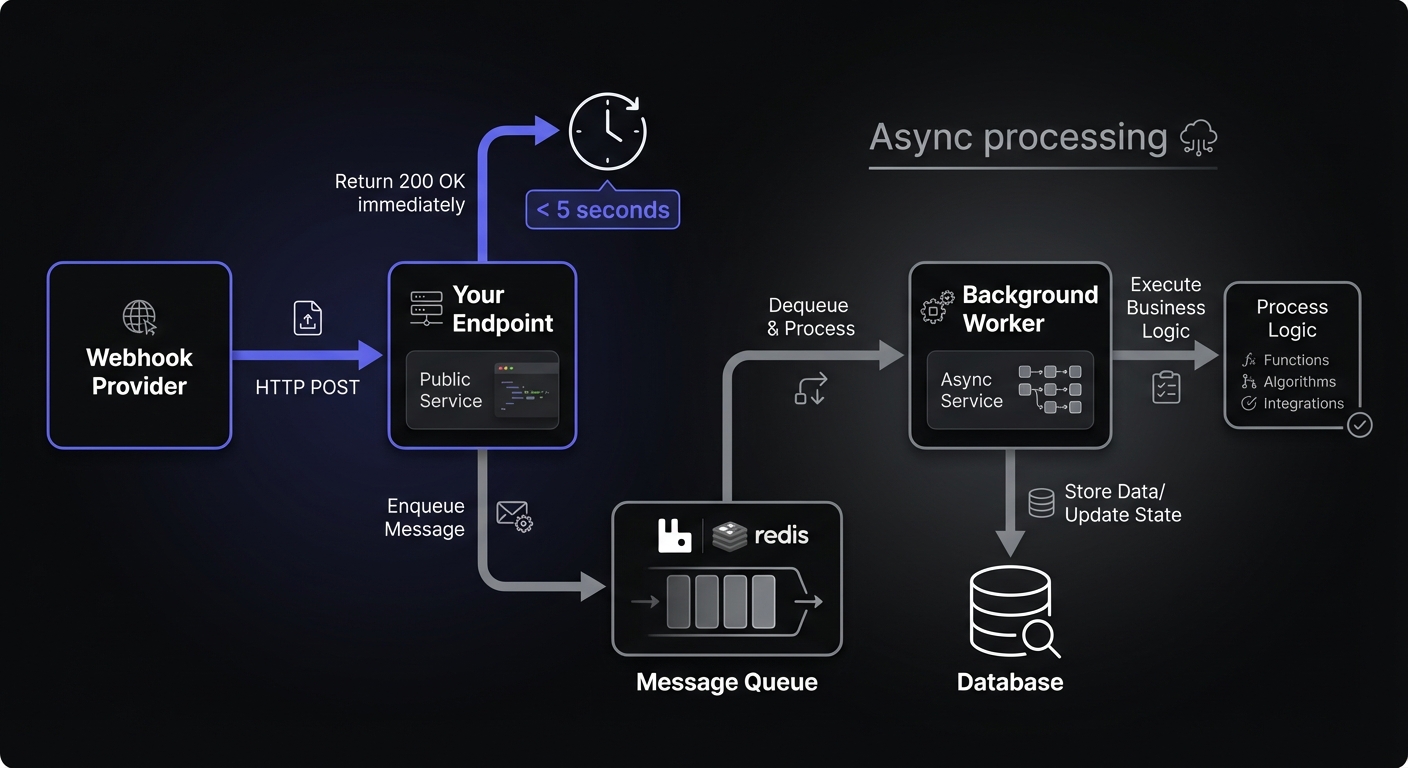
-- Also: move heavy processing to background queueAsync Processing Pattern
Most timeout issues stem from synchronous processing. The solution: acknowledge immediately, process asynchronously.
import Queue from 'bull';

const webhookQueue = new Queue('webhooks', 'redis://localhost:6379');

// Endpoint: acknowledge immediately
app.post('/webhooks', express.raw({ type: 'application/json' }), async (req, res) => {
  const payload = req.body.toString();

  // Verify signature synchronously (fast)
  if (!verifySignature(payload, req.headers['x-webhook-signature'])) {
    return res.status(401).send('Invalid signature');
  }

  // Queue for async processing
  await webhookQueue.add({ payload, headers: req.headers });

  // Return immediately
  res.status(200).send('OK');
});

// Worker: process in background
webhookQueue.process(async (job) => {
  const { payload } = job.data;
  const event = JSON.parse(payload);

  // Heavy processing happens here
  await processEvent(event);
  await updateDatabase(event);
  await notifyDownstream(event);
});
GitHub recommends queue-based architectures using tools like RabbitMQ or Redis to maintain responsiveness within their 10-second window.
Example 3: Missing Events
Symptom: Payments complete, no webhook received.
Issue: Load balancer health check used same path as webhook endpoint, acknowledged requests before application received them.
Solution:
location /health { return 200 'OK'; }
location /webhooks { proxy_pass http://app_server; }
Debugging Checklist
Initial Assessment
- Check provider delivery logs for attempts
- Identify HTTP status code
- Note timestamp and failure frequency
- All webhooks or specific types?
Signature Issues (401/403)
- Secret matches provider and config
- Raw body used (not parsed JSON)
- No middleware payload transformation
- Timestamp within acceptable window
- Test known-good payload
Timeouts (5xx or no response)
- Check app logs for slow operations
- Database query performance
- External API calls in handler
- Adequate resources (memory, CPU, connections)
- Consider background processing
Parsing Issues (400)
- Content-Type header handling
- Character encoding config
- Recent provider schema changes
- Isolated parsing test
Missing Events
- Events enabled in dashboard
- Endpoint URL correct and accessible
- Firewall and network connectivity
- Provider status page for incidents
- webhook.site to isolate issues
Duplicates
- Idempotency using event IDs
- Timeout settings adequate
- Multiple endpoint registrations
- Deduplication logic working
Rate Limiting (429)
- Check provider rate limit documentation
- Review traffic patterns for bursts
- Implement queue-based processing
- Consider dedicated webhook endpoints
SSL/TLS Issues
- Certificate not expired
- Intermediate certificates installed
- Certificate matches domain
- No self-signed certs in production
Silent Failures
- Error handling propagates failures
- Return 5xx on processing errors
- Logging captures all exceptions
- Async operations awaited properly
Proactive Monitoring
Track: total received, successfully processed, failed deliveries, processing duration. Alert on: volume drops, failure rate spikes, processing duration increases, signature failures.
Key Metrics
const metrics = {
  webhooks_received: new Counter({ name: 'webhooks_received_total', labelNames: ['provider', 'event_type'] }),
  webhooks_processed: new Counter({ name: 'webhooks_processed_total', labelNames: ['provider', 'status'] }),
  processing_duration: new Histogram({ name: 'webhook_processing_seconds', labelNames: ['provider'] }),
  signature_failures: new Counter({ name: 'webhook_signature_failures_total', labelNames: ['provider'] })
};

app.post('/webhooks/:provider', async (req, res) => {
  const start = Date.now();
  metrics.webhooks_received.inc({ provider: req.params.provider, event_type: req.body.type });

  try {
    await processWebhook(req);
    metrics.webhooks_processed.inc({ provider: req.params.provider, status: 'success' });
  } catch (error) {
    metrics.webhooks_processed.inc({ provider: req.params.provider, status: 'failure' });
  } finally {
    metrics.processing_duration.observe({ provider: req.params.provider }, (Date.now() - start) / 1000);
  }
});
Alert Conditions
| Alert | Threshold | Priority |
|---|---|---|
| Signature failure rate | > 5% over 5 minutes | High |
| Processing duration P99 | > 5 seconds | Medium |
| Webhook volume drop | > 50% vs previous hour | High |
| Error rate spike | > 10% over 15 minutes | High |
| Queue depth | > 1000 pending | Medium |
For comprehensive observability patterns, including distributed tracing and log aggregation strategies.
Conclusion
Debugging requires systematic investigation. Start with delivery logs, verify signatures step-by-step, test locally with captured payloads, trace through system.
Tools matter: ngrok for local testing, webhook.site for inspection, replay functionality. Proper observability from the start makes debugging faster.
Start simple. Observe carefully. Debug systematically.
Related Posts
Webhook Observability: Logging, Metrics, and Tracing
A comprehensive technical guide to implementing observability for webhook systems. Learn about structured logging, key metrics to track, distributed tracing with OpenTelemetry, and alerting best practices.
Webhook Retry Strategies: Linear vs Exponential Backoff
A technical deep-dive into webhook retry strategies, comparing linear and exponential backoff approaches, with code examples and best practices for building reliable webhook delivery systems.
Webhook Idempotency: Why It Matters and How to Implement It
A comprehensive technical guide to implementing idempotency for webhooks. Learn about idempotency keys, deduplication strategies, and implementation patterns with Node.js and Python code examples.
Securing Webhook Endpoints: A Checklist for Production
A comprehensive, actionable security checklist for production webhook endpoints. Covers transport security, authentication, input validation, rate limiting, logging, and error handling with priority levels and code examples.
HMAC-SHA256 Webhook Signatures: Implementation Guide
Learn how to implement secure webhook signature verification using HMAC-SHA256. Complete guide with code examples for signing and verifying webhook payloads in Node.js and Python.