Webhook Observability: Logging, Metrics, and Tracing
A comprehensive technical guide to implementing observability for webhook systems. Learn about structured logging, key metrics to track, distributed tracing with OpenTelemetry, and alerting best practices.
Webhook Observability: Logging, Metrics, and Distributed Tracing
Webhooks power payment notifications, CI/CD pipelines, integrations. But they're asynchronous and distributed—notoriously difficult to debug. Without proper observability, failures break processes silently until customers complain or revenue is lost.
This guide covers logging, metrics, tracing, and alerting that keep integrations reliable.
Why Observability Matters for Webhooks
Traditional APIs: client → request → response → both know if it worked. Webhooks flip this.
Webhooks are uniquely challenging:
- Fire-and-forget: No visibility once sent
- Variable reliability: Consumer endpoints behave differently
- Retry complexity: Multiple attempts need correlation
- Security: Payloads contain sensitive data
- Scale: Millions of events daily
Proper observability transforms webhooks from black boxes into transparent, debuggable systems.
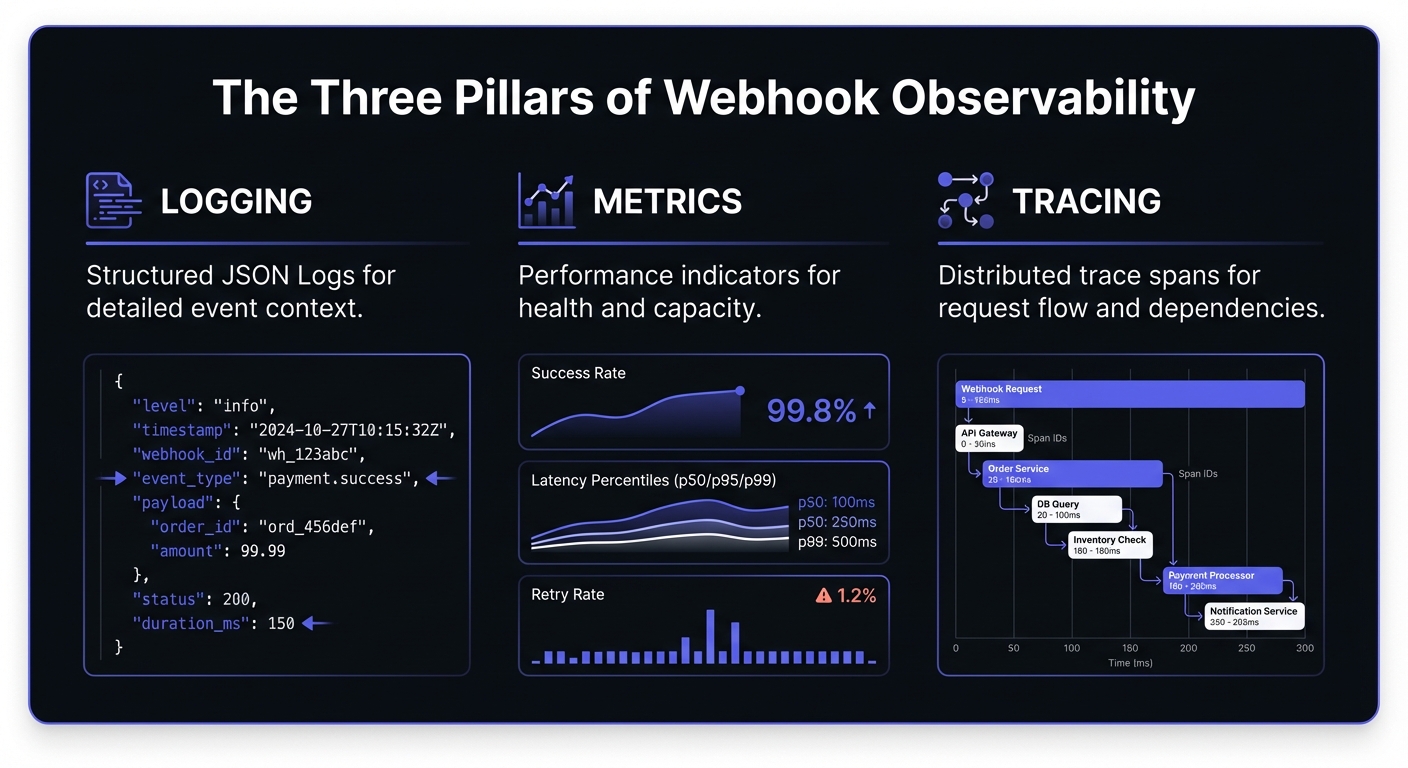
Structured Logging for Webhooks
Unstructured logs like "Webhook failed" are useless at scale. Emit structured logs that can be queried, aggregated, and correlated.
What to Log
Every delivery attempt should capture:
{
  "timestamp": "2026-01-20T14:32:18.445Z",
  "level": "info",
  "event": "webhook.delivery.attempt",
  "webhook_id": "wh_8x7kq2m9n4p1",
  "delivery_id": "del_3j5h7g9f2k4l",
  "endpoint_url": "https://api.customer.com/webhooks",
  "event_type": "payment.completed",
  "attempt_number": 1,
  "request": {
    "method": "POST",
    "headers": {
      "content-type": "application/json",
      "x-webhook-signature": "[REDACTED]"
    },
    "body_size_bytes": 1247,
    "body_hash": "sha256:a3f2b8c9..."
  },
  "response": {
    "status_code": 200,
    "latency_ms": 342,
    "body_preview": "{\"received\": true}"
  },
  "correlation_id": "corr_9m2n4p6q8r1s",
  "trace_id": "4bf92f3577b34da6a3ce929d0e0e4736"
}
Correlation IDs
A correlation ID ties together all log entries for a single operation. When a webhook retries, each attempt shares the correlation ID but has unique delivery IDs. This reconstructs delivery history:
correlation_id=corr_9m2n4p6q8r1s
  └── delivery_id=del_001 (attempt 1, failed, 503)
  └── delivery_id=del_002 (attempt 2, failed, timeout)
  └── delivery_id=del_003 (attempt 3, succeeded, 200)
Security Considerations for Payload Logging
Webhook payloads frequently contain PII, financial data, or authentication tokens. Follow these guidelines:
- Never log full payloads by default. Log a hash or truncated preview instead.
- Implement field-level redaction for known sensitive fields like
password,ssn,credit_card. - Use separate retention policies for payload data versus metadata.
- Consider compliance requirements (GDPR, HIPAA, PCI-DSS) when designing your logging pipeline.
def sanitize_payload(payload: dict) -> dict:
    sensitive_fields = {'password', 'token', 'secret', 'ssn', 'credit_card'}
    return {
        k: '[REDACTED]' if k.lower() in sensitive_fields else v
        for k, v in payload.items()
    }
Log Retention and Compliance
Define retention policies based on compliance requirements and operational needs:
| Data Type | Retention | Rationale |
|---|---|---|
| Delivery metadata | 90 days | Debugging, analytics |
| Payload hashes | 30 days | Deduplication verification |
| Full payloads | 7 days | Active debugging only |
| Error traces | 180 days | Pattern analysis |
| Audit logs | 1-7 years | Compliance (PCI-DSS, SOC 2) |
Implement tiered storage:
- Hot: Last 7 days in fast storage (Elasticsearch, ClickHouse)
- Warm: 8-90 days in cost-optimized storage (S3 + Athena)
- Cold: 90+ days in archive (Glacier) for compliance
Key Metrics to Track
Essential metrics for webhook systems:
Delivery success rate: Percentage delivered successfully on first attempt and after all retries. Track both. Low first-attempt with high ultimate = endpoint instability. Low ultimate = serious problem.
Latency percentiles: Track p50, p95, p99. Average latency hides outliers.
p50: 0.245s p95: 1.832s p99: 4.521s
Retry rate: High rates = systemic issues. Break down by endpoint.
retry_rate = total_retry_attempts / total_webhooks
Endpoint health score: Aggregate metrics per endpoint:
def calculate_endpoint_health(endpoint_id: str, window_hours: int = 24) -> float:
    metrics = get_endpoint_metrics(endpoint_id, window_hours)

    success_weight = 0.5
    latency_weight = 0.3
    availability_weight = 0.2

    success_score = metrics.success_rate
    latency_score = 1.0 - min(metrics.p95_latency / 5.0, 1.0)  # 5s threshold
    availability_score = metrics.uptime_percentage

    return (success_score * success_weight +
            latency_score * latency_weight +
            availability_score * availability_weight)
Throughput and queue depth: Monitor capacity. Growing depth means falling behind.
Business Metrics
Technical metrics alone miss the impact. Track business outcomes tied to webhooks:
| Metric | Description | Example |
|---|---|---|
| Payments processed | Financial events delivered | $1.2M/day |
| Orders posted | E-commerce integrations | 15,000/hr |
| User events synced | Identity/CRM updates | 50,000/day |
| Revenue at risk | Value in DLQ/failed | $45,000 pending |
Correlate technical failures with business impact: "P99 latency spike caused 3% payment delay, affecting $36,000 in processing."
Error Budgets and SLOs
Define Service Level Objectives for webhook delivery:
SLO: 99.5% delivery success within 30 seconds
Error budget: 0.5% = 43 minutes/month of failure tolerance

Monthly webhooks: 10,000,000
Allowed failures: 50,000 (0.5%)
Track error budget consumption:
def calculate_error_budget_remaining(
    slo_target: float,
    current_success_rate: float,
    period_elapsed_percent: float
) -> float:
    error_budget_total = 1.0 - slo_target  # 0.005 for 99.5%
    error_budget_used = 1.0 - current_success_rate
    expected_consumption = error_budget_total * period_elapsed_percent

    return (expected_consumption - error_budget_used) / error_budget_total * 100
Distributed Tracing with OpenTelemetry
Distributed tracing connects the dots across service boundaries. When a webhook is part of a larger transaction (e.g., user action triggers API call, which triggers webhook, which triggers downstream processing), traces let you see the complete picture.
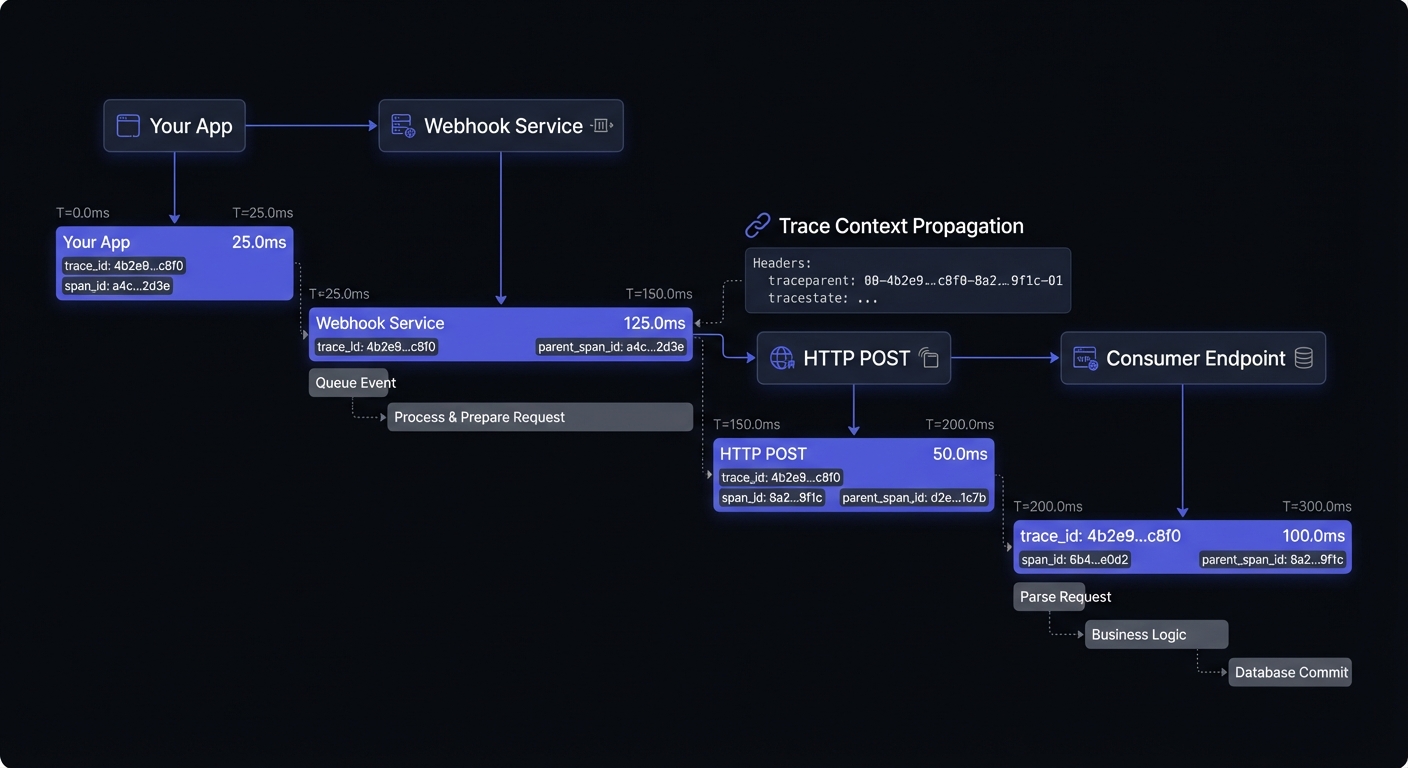
Implementing Trace Context Propagation
Use the W3C Trace Context standard to propagate trace IDs through webhook deliveries:
from opentelemetry import trace
from opentelemetry.propagate import inject

tracer = trace.get_tracer(__name__)

def deliver_webhook(endpoint_url: str, payload: dict, headers: dict):
    with tracer.start_as_current_span("webhook.deliver") as span:
        span.set_attribute("webhook.endpoint", endpoint_url)
        span.set_attribute("webhook.event_type", payload.get("type"))

        # Inject trace context into outgoing headers
        inject(headers)

        response = requests.post(endpoint_url, json=payload, headers=headers)

        span.set_attribute("webhook.response.status_code", response.status_code)
        span.set_attribute("webhook.response.latency_ms", response.elapsed.total_seconds() * 1000)
The receiving endpoint can extract the trace context and continue the trace:
from opentelemetry.propagate import extract

def webhook_handler(request):
    context = extract(request.headers)
    with tracer.start_as_current_span("webhook.process", context=context):
        # Process webhook with trace context preserved
        process_event(request.json())
Trace Sampling
At high volumes, trace selectively:
- Head-based: Decide at start (e.g., 1% sample)
- Tail-based: Decide after completion (all errors, 1% successes)
- Priority: Always trace high-value (payments, security)
OpenTelemetry Collector Setup
Configure the OpenTelemetry Collector for webhook telemetry:
# otel-collector-config.yaml
receivers:
  otlp:
    protocols:
      grpc:
        endpoint: 0.0.0.0:4317
      http:
        endpoint: 0.0.0.0:4318

processors:
  batch:
    timeout: 10s
    send_batch_size: 1000
  attributes:
    actions:
      - key: service.name
        value: webhook-delivery
        action: upsert

exporters:
  prometheus:
    endpoint: 0.0.0.0:8889
  jaeger:
    endpoint: jaeger:14250
    tls:
      insecure: true

service:
  pipelines:
    traces:
      receivers: [otlp]
      processors: [batch, attributes]
      exporters: [jaeger]
    metrics:
      receivers: [otlp]
      processors: [batch]
      exporters: [prometheus]
Prometheus and Grafana Integration
Export webhook metrics to Prometheus for long-term storage and alerting:
from prometheus_client import Counter, Histogram, Gauge

# Define metrics
webhook_deliveries_total = Counter(
    'webhook_deliveries_total',
    'Total webhook delivery attempts',
    ['endpoint', 'event_type', 'status']
)

webhook_delivery_latency = Histogram(
    'webhook_delivery_latency_seconds',
    'Webhook delivery latency',
    ['endpoint'],
    buckets=[0.1, 0.25, 0.5, 1.0, 2.5, 5.0, 10.0]
)

webhook_queue_depth = Gauge(
    'webhook_queue_depth',
    'Current webhook queue depth',
    ['priority']
)

# Instrument delivery
def deliver_with_metrics(endpoint: str, event_type: str, payload: dict):
    with webhook_delivery_latency.labels(endpoint=endpoint).time():
        response = deliver_webhook(endpoint, payload)

    status = 'success' if response.ok else 'failure'
    webhook_deliveries_total.labels(
        endpoint=endpoint,
        event_type=event_type,
        status=status
    ).inc()
Grafana Dashboard Queries
Key PromQL queries for your webhook dashboard:
# Success rate (5-minute window)
sum(rate(webhook_deliveries_total{status="success"}[5m])) /
sum(rate(webhook_deliveries_total[5m])) * 100

# P99 latency
histogram_quantile(0.99, sum(rate(webhook_delivery_latency_seconds_bucket[5m])) by (le))

# Failure rate by endpoint
sum(rate(webhook_deliveries_total{status="failure"}[5m])) by (endpoint)

# Queue depth trend
webhook_queue_depth
Alerting Strategy
Define actionable, meaningful alerts:
| Alert | Threshold | Severity |
|---|---|---|
| Success rate | < 95% / 5 min | Critical |
| P99 latency | > 10s | Warning |
| Queue depth | > 10,000 growing | Warning |
| Circuit breaker open | Any endpoint | Info |
| DLQ growth | > 100/hr | Critical |
Avoid alert fatigue: Set appropriate thresholds, group related alerts, route by severity, create runbooks.
Sample Runbook Structure
## Alert: Webhook Success Rate Below Threshold
### Symptoms
- Success rate < 95% for 5+ minutes
- Increased retry attempts
### Investigation Steps
1. Check endpoint health dashboard for affected endpoints
2. Review recent deployments that might have changed payload format
3. Verify no network/DNS issues to major endpoint regions
4. Check for rate limiting responses (429 status codes)
### Remediation
- If single endpoint: Contact customer, consider circuit breaker
- If widespread: Check for payload schema changes, rollback if needed
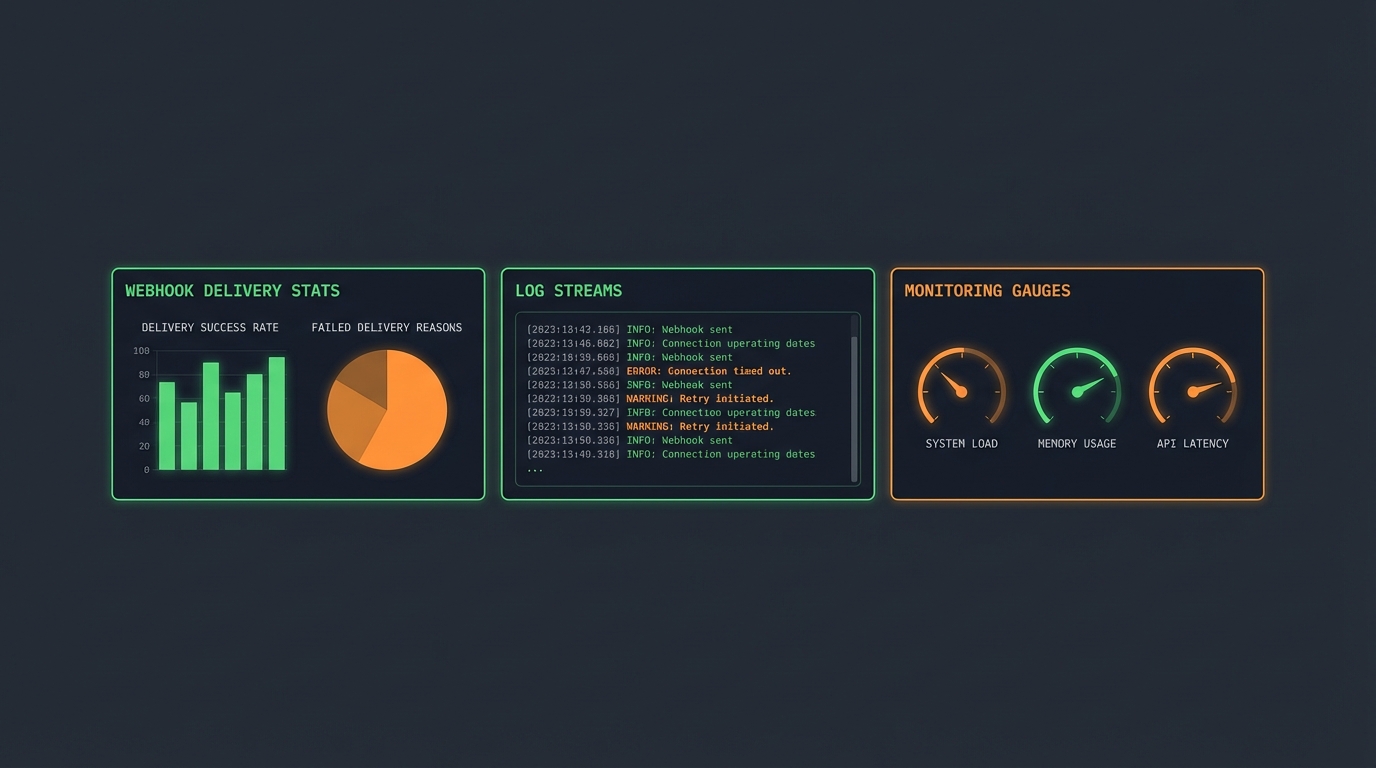
- If infrastructure: Engage platform teamBuilding Your Observability Dashboard
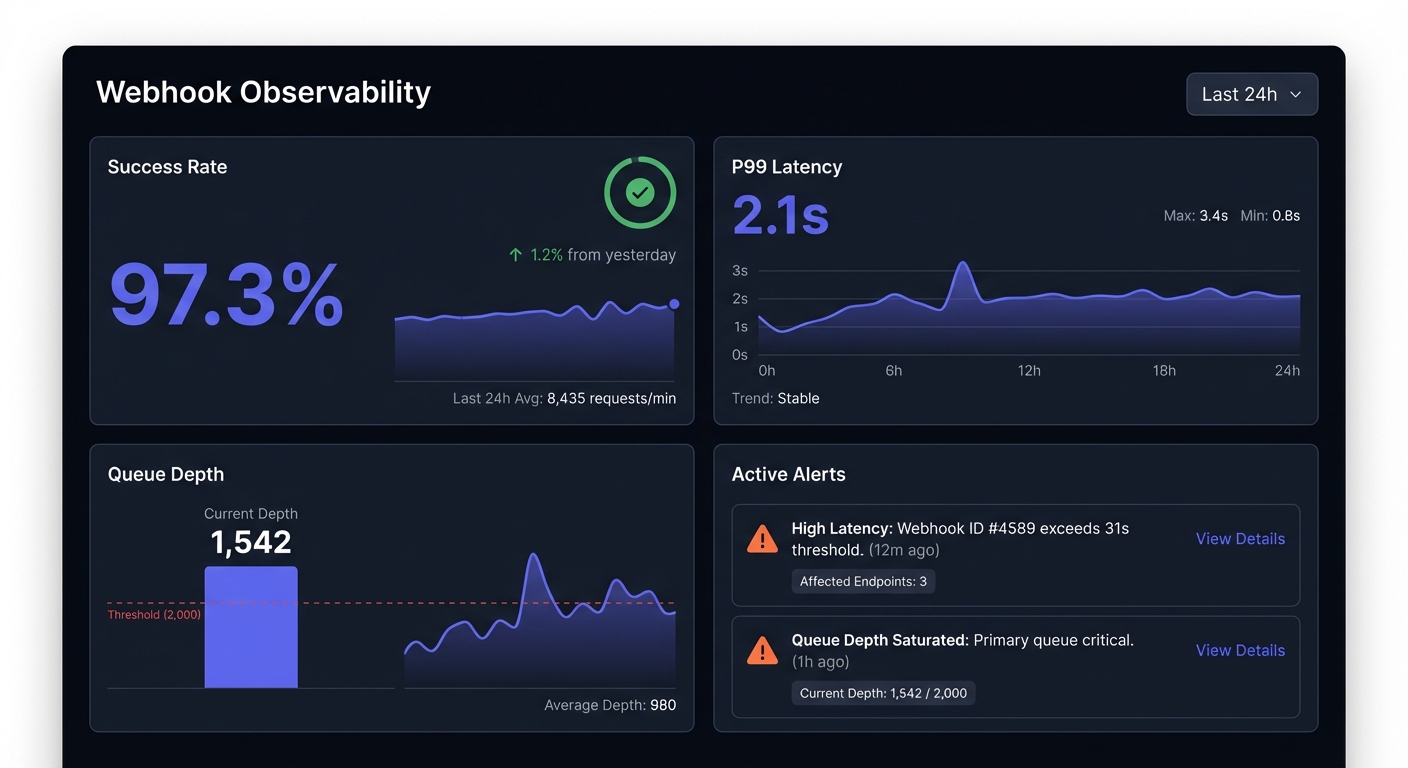
Top row: Success rate, active alerts, queue depth
Second row: Volume, success rate, latency trends over time
Third row: Success by endpoint, error distribution, top failures
Bottom row: Recent failures, retry distribution, endpoint health
Conclusion
Webhook observability is essential for reliable integrations at scale. Structured logging with correlation IDs, right metrics, distributed tracing, and actionable alerts transform webhooks from black boxes into transparent systems.
Observability is foundational for debugging in production and webhook reliability engineering. Start with basics: structured logs and core metrics. Add tracing as you scale. Build dashboards surfacing problems before customers notice. For scaling webhook systems, investing early pays dividends.
Related Posts
Debugging Webhooks in Production: A Systematic Approach
Learn how to debug webhook issues in production with a systematic approach covering signature failures, timeouts, parsing errors, and more. Includes practical tools, real examples, and step-by-step checklists.
Webhook Retry Strategies: Linear vs Exponential Backoff
A technical deep-dive into webhook retry strategies, comparing linear and exponential backoff approaches, with code examples and best practices for building reliable webhook delivery systems.
Webhook Circuit Breakers: Protect Your Infrastructure
Learn how to implement the circuit breaker pattern for webhook delivery to prevent cascading failures, handle failing endpoints gracefully, and protect your infrastructure from retry storms.
Webhook Dead Letter Queues: Complete Technical Guide
Learn how to implement dead letter queues (DLQ) for handling permanently failed webhook deliveries. Covers queue setup, failure criteria, alerting, and best practices for webhook reliability.
From 0 to 10K Webhooks: Scaling Your First Implementation
A practical guide for startups on how to scale webhooks from your first implementation to handling 10,000+ events per hour. Learn what breaks at each growth phase and how to fix it before your customers notice.